


Dividend Yield on Cost Explained: Formula, Example, and How to Use It
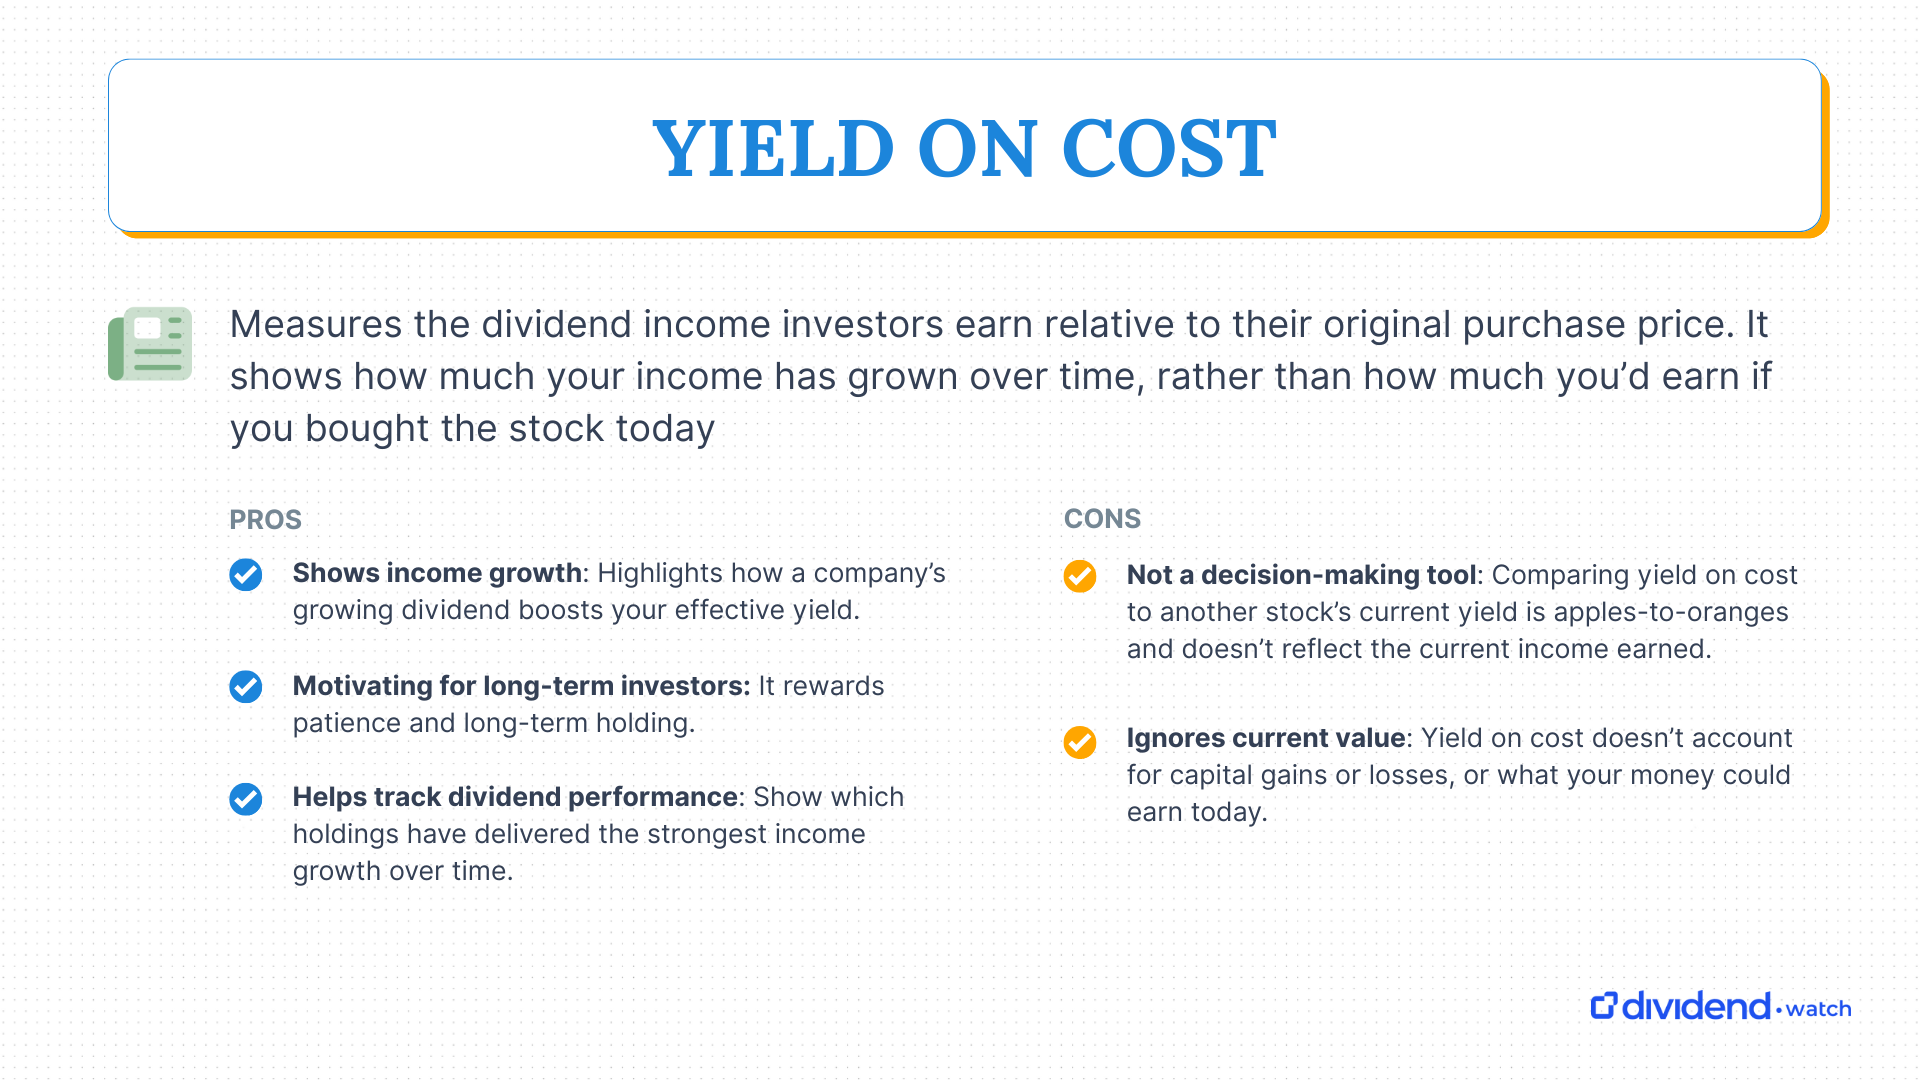
Yield on cost measures the dividend income investors earn relative to their original purchase price. It shows how much your income has grown over time, rather than how much you’d earn if you bought the stock today, which is the dividend yield.
While the metric can be a satisfying way to see how far your income has come, it’s not always the best guide for where you’re going next. Like a rearview mirror, it reflects past performance, but isn’t always useful for forward-looking decisions. In this guide, we’ll break down exactly what yield on cost is, how to calculate it, when to use it to your advantage, and when to leave it in the background.
Yield on cost formula and example
Let’s start with an example of how to calculate yield on cost using a real-life example with Johnson and Johnson (JNJ) stock.
Formula: Yield on cost = Current annual dividend ÷ Original purchase price
About a decade ago, you could buy JNJ shares for around $100. In more recent times, the stock has an annual dividend of $5.02, resulting in a yield on cost of 5.02% (5.02 ÷ 100 = 5.02%). This figure reflects the annual income earned based on the original investment, not what you’d earn today opening a new position.
In contrast, the current dividend yield is lower at 3.29%, representing the annual income earned based on the recent share price.
Why is yield on cost important?
Yield on cost is a clear snapshot of how your dividend income has grown over time, especially helpful for long-term investors focused on income compounding. It tells the story of how far your income has come, even if it doesn’t always guide what comes next. Over time, a stock with regular dividend increases can produce a yield on cost many times higher than its original yield.
This growth is key for compounding income since yield on cost helps visualize the long-term payoff of holding quality dividend stocks.
However, do not use this metric to compare different investment options today. Current dividend yield and total return expectations are more relevant.
Yield on cost vs. dividend yield
When comparing yield on cost and trailing dividend yield, it’s essential to understand the key differences and how each metric influences investment decisions. We’ve provided below a simple overview of how the two yield metrics compare and their use cases.
| Metric | Yield on Cost | Dividend Yield |
|---|---|---|
| Based on | Original purchase price | Current market price |
| Reflects | Income growth since purchase | Current income potential |
| Use case | Historical view for long-term holders | Current view for new investment decisions |
In short, yield on cost tells you how far you’ve come. Dividend yield tells you more about the recent history, with forward dividend yield telling you what’s ahead. Knowing this, dividend yield is the better option for comparing stocks when making new buy or selling decisions, considering future income needs and dividend growth potential.
Dividend reinvestment and yield on cost
Reinvesting dividends impacts both your income and your yield on cost. While reinvested dividends increase your share count and income stream, they can also lower the overall yield on cost if the new shares are purchased at higher prices.
As reinvestments happen at higher prices, the cost basis increases, and the blended yield on cost may decrease even though the total dividend income is rising.
A high yield on cost isn’t always better
Yield only considers income, not price appreciation or reinvested dividends. A stock may deliver an excellent yield on cost but a poor total return, which can modestly complicate determining whether a high or low yield on cost is better. Consider the following scenarios to illustrate why total return may be a more insightful metric to gauge overall performance.
| Investment | Purchase Price | Current Price | Dividend | Yield on Cost | Total Return |
|---|---|---|---|---|---|
| Stock A | $50 | $55 | $3.00 | 6.0% | 16% ($5 gain + $3 dividend) |
| Stock B | $50 | $30 | $3.00 | 6.0% | -34% ($20 loss + $3 dividend) |
As you can see, both stocks have the same yield on cost, but only Stock A has been profitable overall. This scenario analysis shows that a high yield on cost doesn’t always mean you’re making money, as a declining share price can drag on total returns.
Portfolio-level yield on cost
Successful long-term investing requires more than just assessing performance for a single stock. The portfolio-level yield on cost highlights how effective your overall income strategy has been. Thankfully, calculating the figure for a portfolio is straightforward.
Formula: Portfolio yield on cost = Total annual dividends ÷ Total original cost basis
This aggregated yield insight gives a big-picture view of how income has evolved over time. Just be sure that the cost basis accounts for all additional purchases and dividend reinvestments.
Considerations for retirement planning
Retirees often love seeing a 20%+ yield on cost on a stock they’ve held for decades. But this number can be misleading if it’s confused with the current yield.
For example, you might have bought a stock at $25 years ago, and it now pays a $5 dividend, a 20% yield on cost. However, if that same stock is now worth $167, its current dividend yield is only 3%.
The key point? When planning for retirement income, it’s the 3% dividend yield that reflects how much income your shares are generating based on their current value.
Where can you find yield on cost?
Most brokerage providers don’t provide in-depth dividend-focused analytics, including yield on cost. However, the dividend tracker inside Dividend Watch includes this figure for individual holdings and at the aggregate portfolio level based on your cost basis, simplifying otherwise manual calculations.
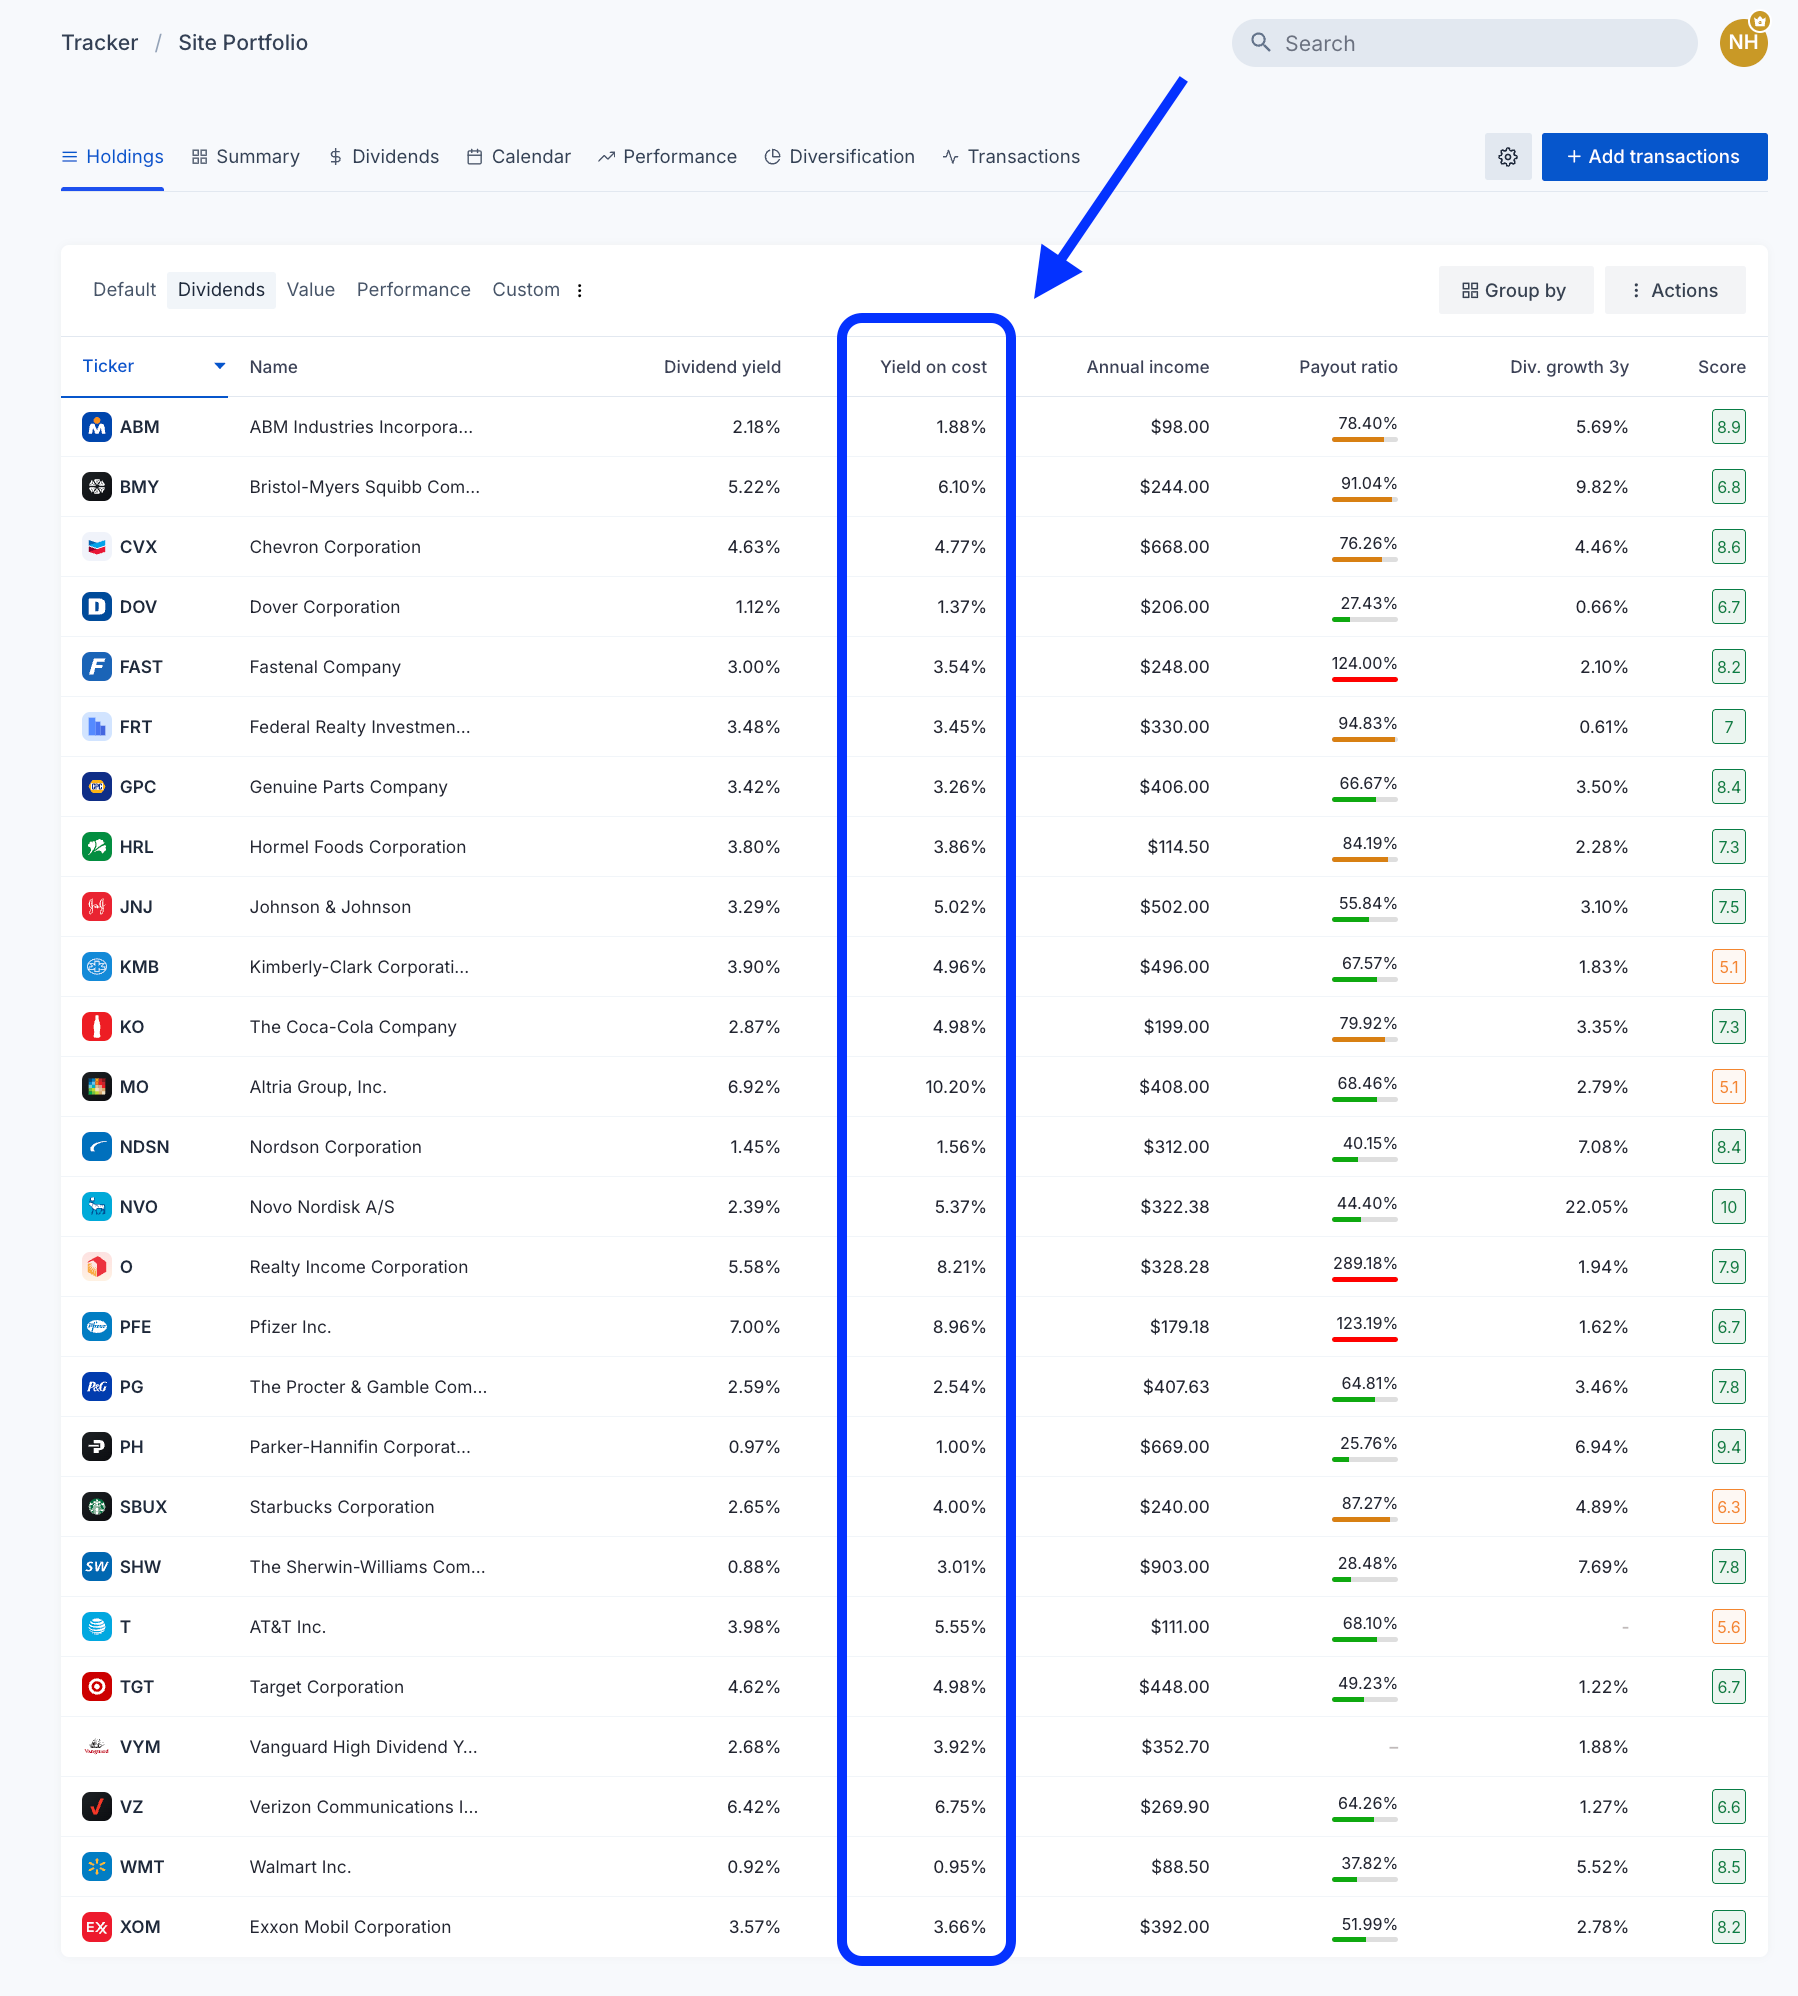
Enter your holdings in the portfolio tracker to automatically calculate and track yield on cost for each security. Source: Dividend Watch
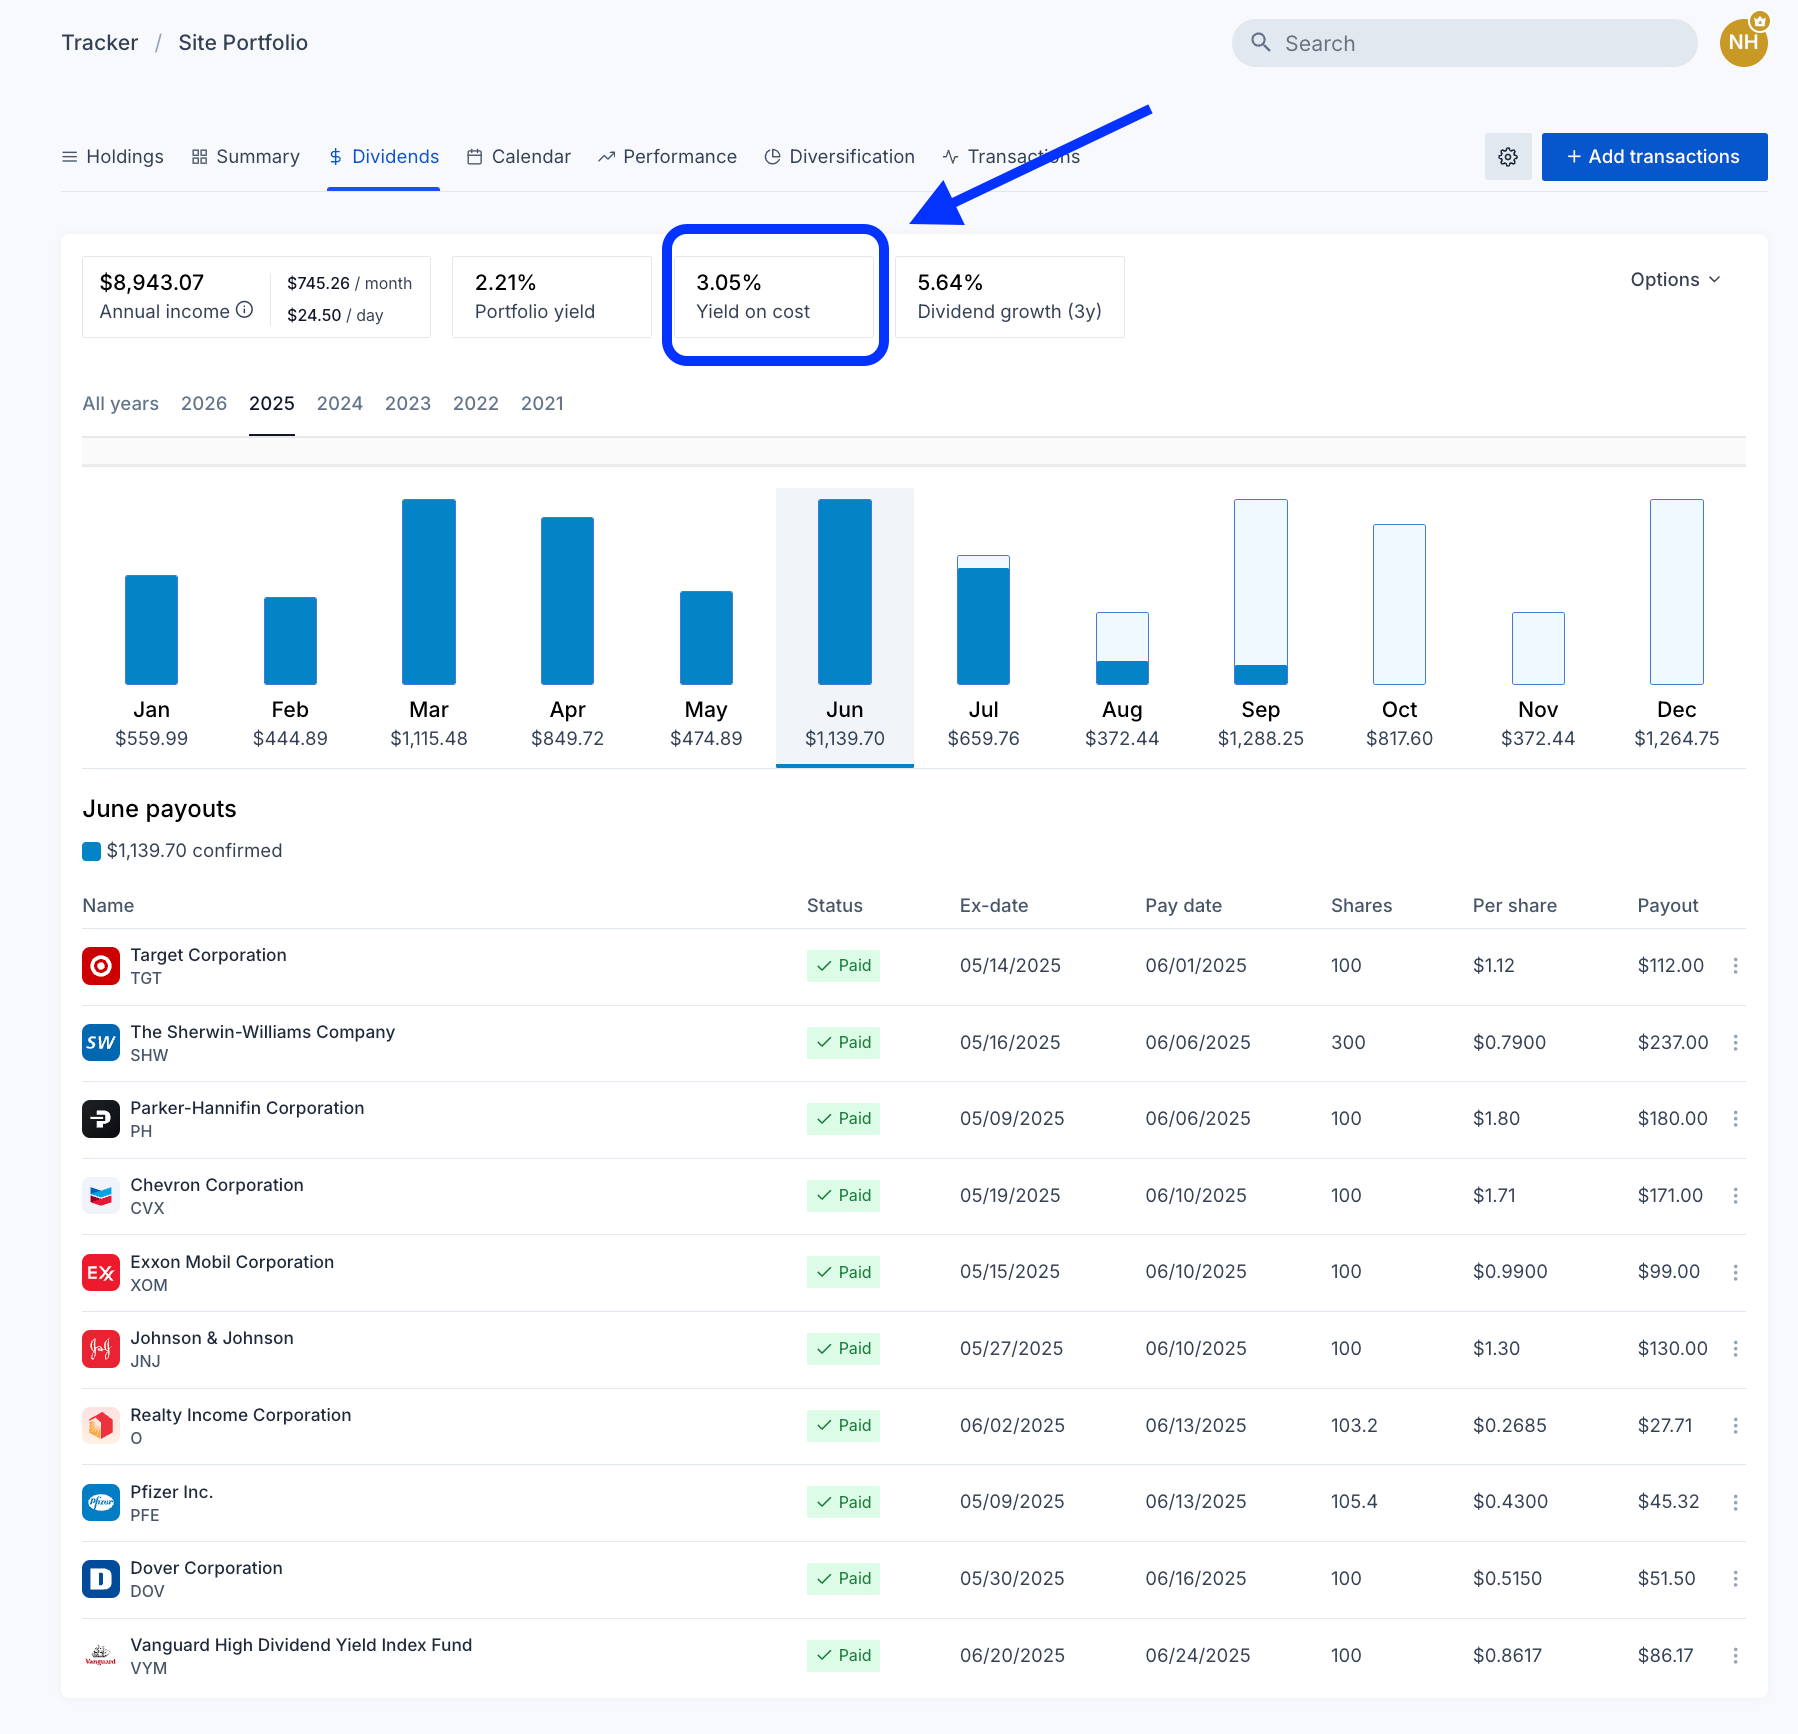
Dividend Watch automatically calculates the overall yield on cost for your portfolio. Source: Dividend Watch
Alternatively, use our yield on cost calculator or our dividend calculator to calculate the metric based on custom inputs and currencies for scenario analysis.


