


Dividend Yield 101: What It Is, Formula, and Why It Matters
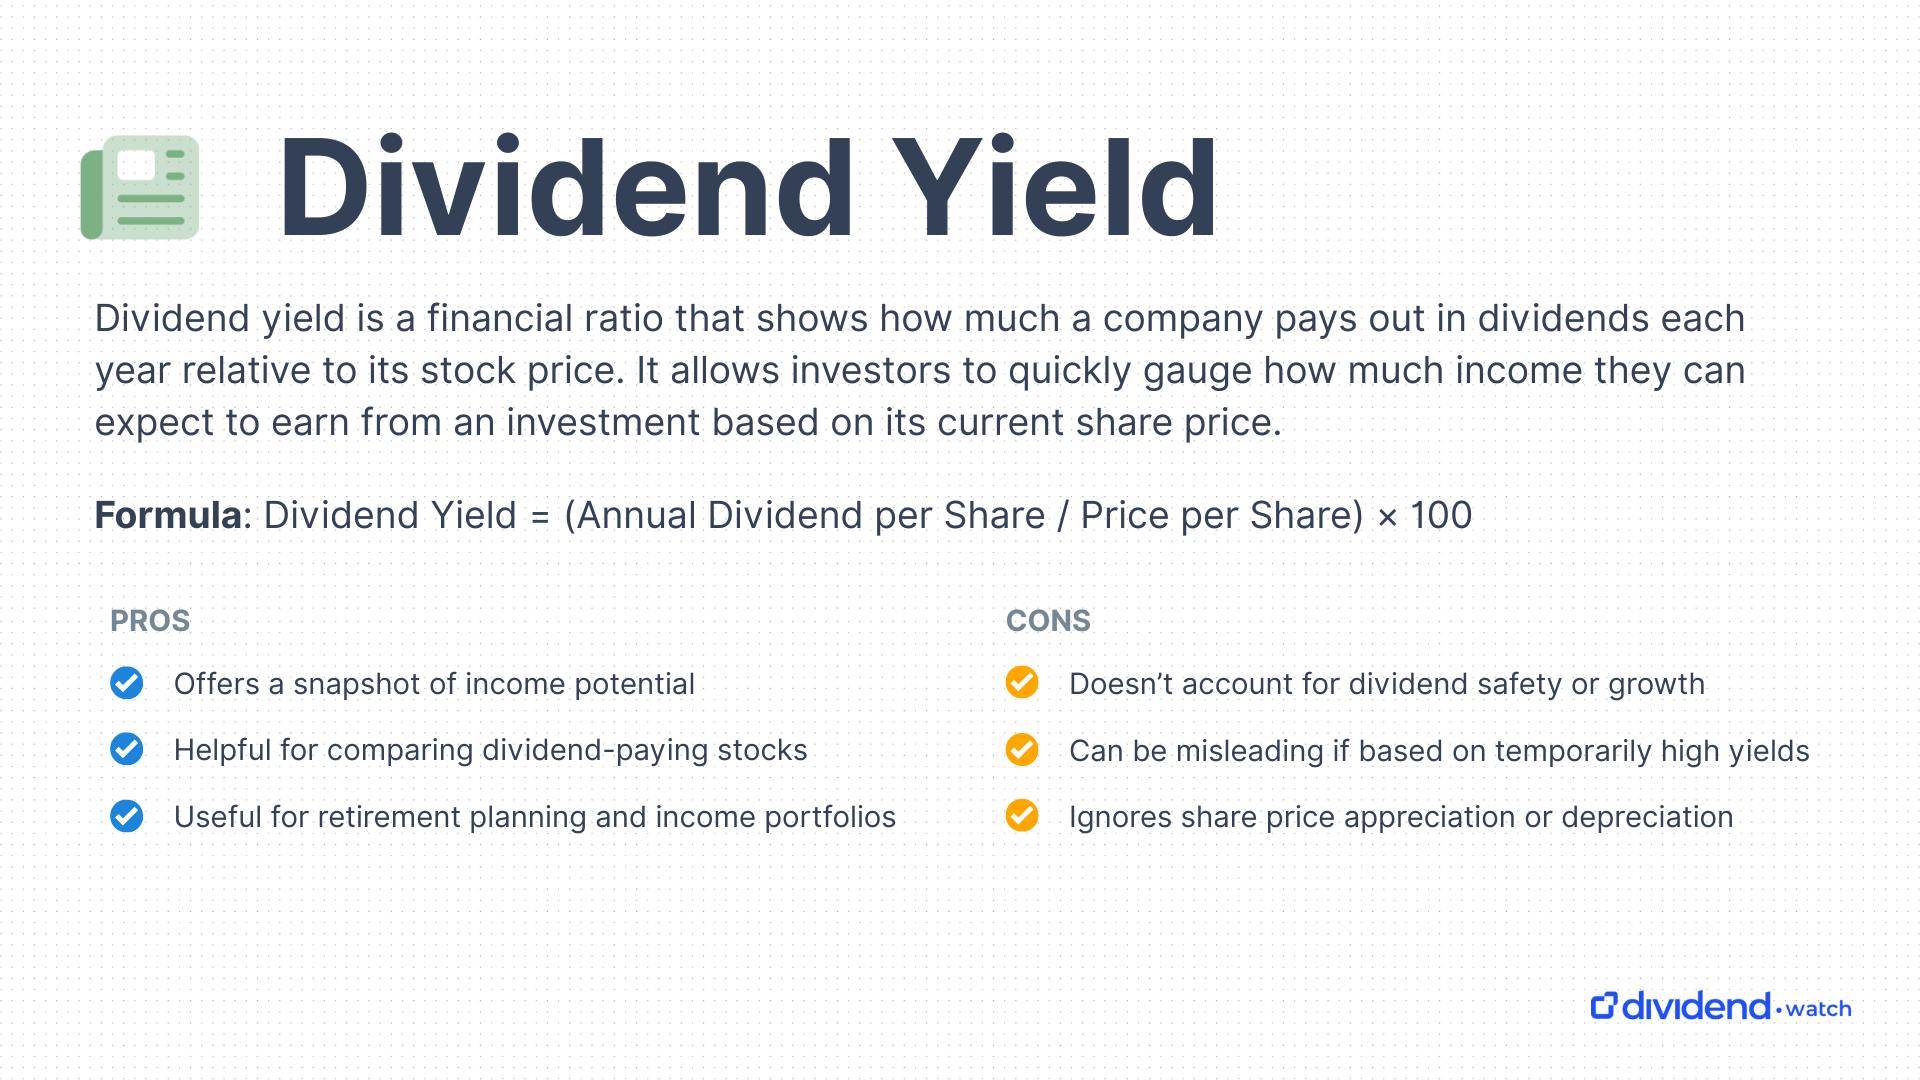
Dividend yield is a financial ratio that shows how much a company pays out in dividends each year relative to its stock price. Expressed as a percentage and commonly measured over the trailing twelve months, dividend yield allows investors to quickly gauge how much income they can expect to earn from an investment based on its current share price. For example, if a company’s stock trades at $100 and it pays $3 in annual dividends, the dividend yield is 3%.
The metric is a key ratio when investing in dividend stocks that investors often turn to as a quick, insightful snapshot of a stock’s income potential. It helps them sift through income-producing opportunities, compare companies head-to-head, and decide if a stock aligns with their goals, whether that’s earning steady income now or building wealth through dividend growth over time.
Dividend Yield Formula: Example Calculation
Here’s how it plays out in real life using Apple Inc. (AAPL) plugged into the dividend yield equation.
Trailing Dividend Yield = (Annual Dividend per Share / Share Price) × 100
Apple recently paid an annual dividend of $1.01 per share, and its stock trades at around $200, resulting in a 0.505% dividend yield.
That yield means if you put $1,000 into Apple stock, you’d earn $5.05 per year in dividends, assuming no changes.
You can also calculate dividend yield on a broader scale by dividing the total dividends paid on the cash flow statement by the company’s market capitalization. It’s the same concept, just zoomed out from the per-share level to the entire company.
Why Is Dividend Yield Important?
Dividend yield is one of the first numbers savvy investors look at, and for good reason. It offers a simple yet powerful way to understand how much income a stock might generate based on your current investment.
It’s especially helpful for income-focused investors who rely on regular payouts, like retirees or those building cash-flow-driven portfolios. A solid dividend yield can give you an idea of your expected cash return, helping you gauge whether a stock fits your financial needs.
Dividend growth investors also keep a close eye on yield. By comparing a company’s current yield to its historical average, they can spot opportunities that might indicate undervaluation or potential red flags.
But remember that higher isn’t always better. A sky-high yield might look tempting, but it can also be a warning sign that the dividend isn’t sustainable. On the flip side, a modest yield from a company with a rock-solid track record of growing its dividend can lead to far better long-term results. It’s not just about what the dividend pays today. It’s about what it can become tomorrow.
Using Dividend Yield To Research Stocks
On its own, the dividend yield offers a helpful snapshot. Still, it becomes far more powerful when combined with other metrics, such as payout ratio, earnings growth, and dividend growth history. Think of it as the starting point for deeper analysis, not the final answer.
A rising dividend yield might be a golden opportunity or a flashing red flag. If a company usually yields 2% and now offers 4%, it could be undervalued. But it might also be struggling, with a falling share price inflating the yield. Context is everything.
That’s why seasoned investors compare current yields to historical norms, examine dividend coverage, and scrutinize sector trends. Used wisely, dividend yield helps you screen stocks, uncover value, and understand how the market feels about a company’s payout future.
What’s A Good Dividend Yield?
There’s no universal "perfect" dividend yield as it depends on your investment goals and risk tolerance. But there are some helpful benchmarks to guide expectations.
- Dividend growth stocks (0.50%–4%) – These aren’t the highest yields, but they shine over time. The real value here is in steady payout increases and long-term compounding.
- High-yield stocks (5%+) – These are appealing for those who want more immediate cash flow. But with higher yields often comes higher risk. Watch out for companies with unstable businesses or unsustainable payout ratios.
Sector Dividend Yield Benchmarks
Dividend yields can vary dramatically depending on the sector, and for good reason. Each sector and industry has its own approach to profits and macroeconomic characteristics that affect cash flow stability. Some companies reinvest aggressively, while others return more to shareholders. Here’s a quick rundown of ballpark yield ranges by sector.
- Consumer discretionary (1%–2%) – Because earnings in this sector are tied to economic cycles, companies tend to keep dividends lower to stay flexible during slowdowns.
- Consumer staples (2%–4%) – These companies sell essentials, making their cash flows more stable. That stability supports consistent, growing dividends.
- Energy (3%–6%) – Energy stocks can offer juicy yields, but beware that their payouts are highly tied to commodity prices and market swings.
- Financials (2%–4%) – Banks, insurers, and asset managers tend to offer solid, dependable dividends, especially when interest rates are favorable.
- Healthcare (1.5%–3%) – A balanced mix. Many healthcare firms return cash to shareholders while still investing in R&D and regulatory hurdles.
- Industrials (1.5%–3.5%) – A mixed bag. Capital-intensive firms may pay less, while stable operators often return a decent share of earnings.
- Real Estate/REITs (4%+) – REITs are legally required to distribute most of their income, making them popular among income investors.
- Technology (0.5%–2%) – Tech companies often pour profits back into innovation and growth, so dividend payouts are modest. But when a tech firm does pay a dividend, it often signals maturity.
- Telecom (3%–6%) – With high infrastructure costs and steady cash flows, telecom firms often deliver reliable dividends to shareholders.
- Utilities (3%–5%) – With predictable demand and regulated pricing, utilities are dividend workhorses. Yields tend to be high and steady.
Related Yield Ratios
Beyond dividend yield, several related metrics offer a deeper look into income potential and performance over time. These ratios help investors assess future dividend income or evaluate how their yield has grown since purchase, which are key insights for anyone focused on building a reliable dividend portfolio.
Forward yield
Forward dividend yield projects dividend yield based on expected future dividends, not the trailing twelve months. This forward-looking measure is especially useful when companies are growing or cutting dividends, so it should be used to estimate income based on upcoming changes.
Yield on cost
Yield on cost compares the annual dividend income to the original investment cost. For example, if you bought a stock at $50 and it pays $2 annually, your yield on cost is 4%, even if the stock now trades at $100 and has a trailing dividend yield of 2%. This metric is useful for tracking long-term income growth from dividend-growth stocks.
Dividend Yield Vs. Payout Ratio
While dividend yield tells you the return based on the stock price, the payout ratio shows how much of a company's earnings are being paid out as dividends. A high yield with a high payout ratio may be unsustainable if the company is unable to cover the dividend with earnings, requiring other sources of capital, such as equity or debt financing. Comparing the two ratios can help gauge the safety of dividends.
After-Tax Dividend Yield
Not all dividend income is treated equally, especially depending on the account type in which you own dividend stocks. After-tax yield is what really matters for taxable brokerage accounts, because dividend taxes can take a real bite out of your income. You can calculate the after-tax yield as follows.
After-Tax Dividend Yield = Yield x (1 - Your Tax Rate)
For example, if a stock yields 4% and your tax rate on dividends is 15%, your after-tax yield is 4% × (1 – 0.15) = 3.4%. Your actual return depends on both your tax bracket and the type of account in which you hold the investment, such as taxable accounts versus IRAs or Roth IRAs.
You can also use our dividend calculator to understand the potential growth of your portfolio and how taxes affect returns and reinvested dividends.
S&P 500 Dividend Yield
As of June 2025, the S&P 500’s dividend yield is 1.25%, according to data from YCharts. The relatively low yield reflects the index's heavy weighting in growth-oriented tech stocks that reinvest earnings rather than pay dividends.
Dow Jones Dividend Yield
In contrast, the Dow Jones Industrial Average, composed of 30 blue-chip stocks, generally carries a higher yield than the S&P 500. As of June 2025, the Dow’s average dividend yield is 1.78%. This higher yield is largely because it includes mature, dividend-paying companies in sectors such as industrials, healthcare, and consumer goods.
Where Do You Find Dividend Yield?
You can find dividend yield data on most financial platforms, but for dividend-focused investors, specialized tools matter. Dividend Watch’s portfolio tracker offers a streamlined dashboard that shows yield data for individual stocks, watchlists, and your full portfolio, making it easier to evaluate income potential at a glance.
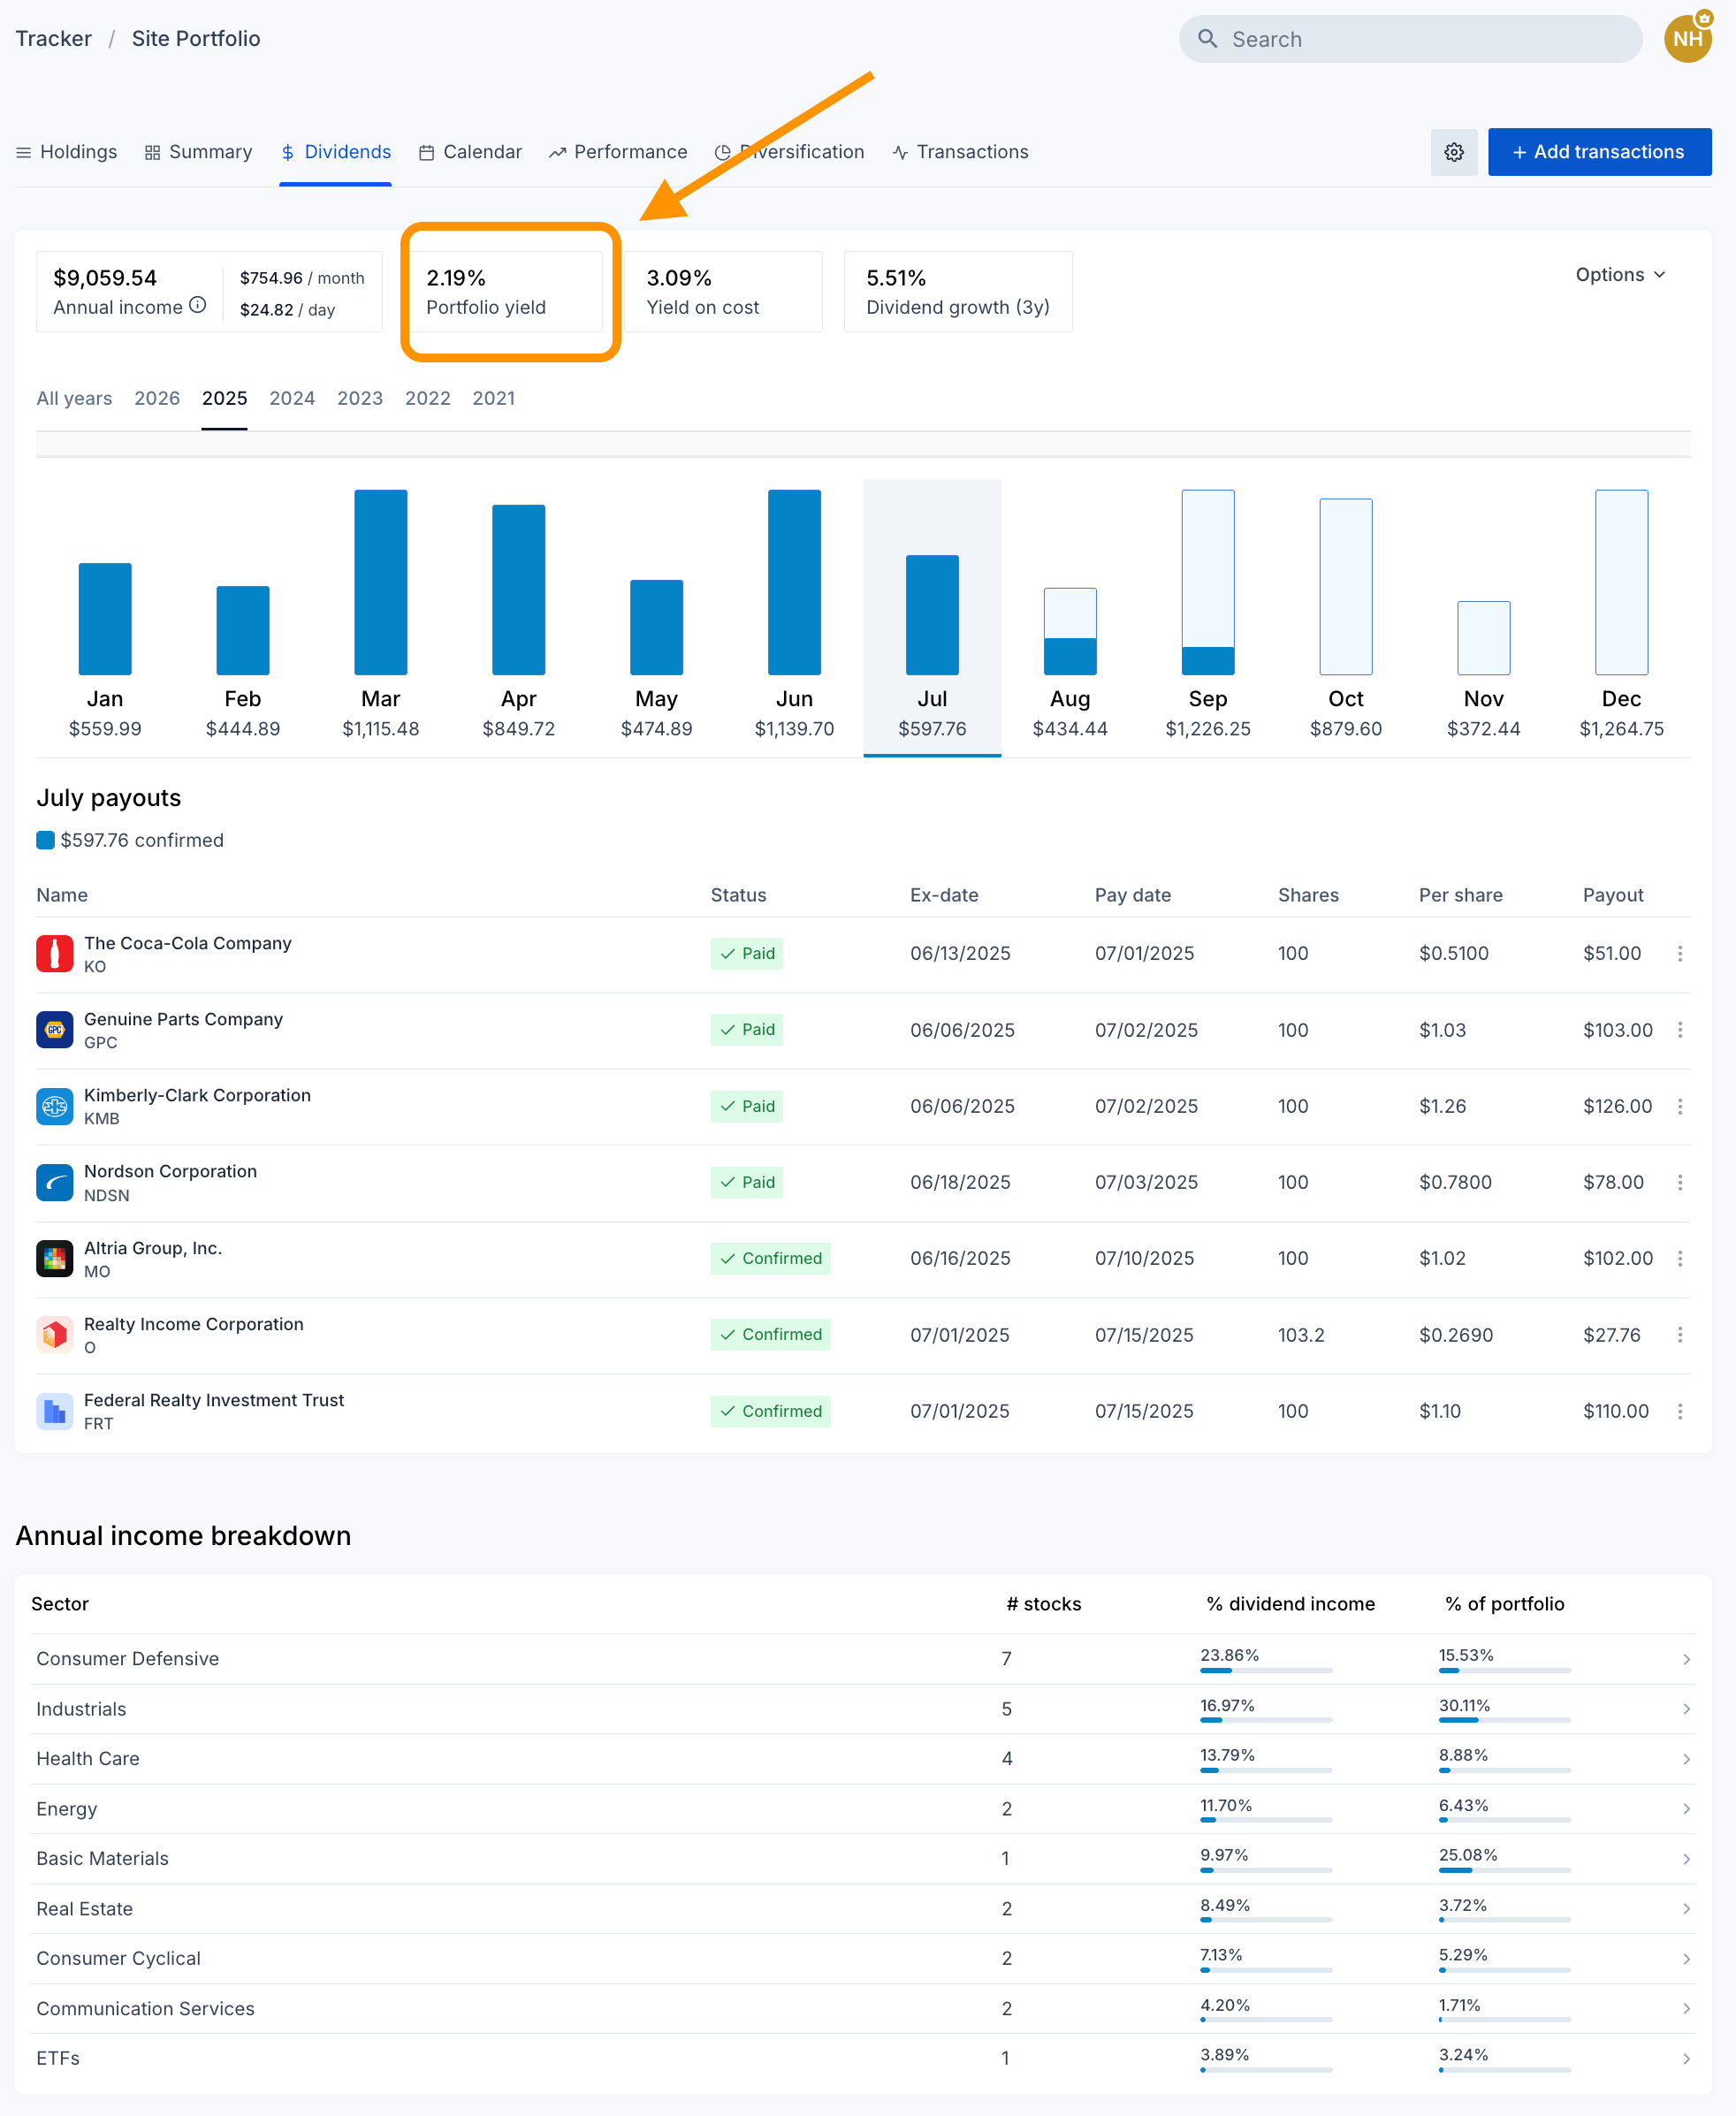
Get detailed portfolio-level yield analytics to simplify planning income and stock diversification. Source: Dividend Watch
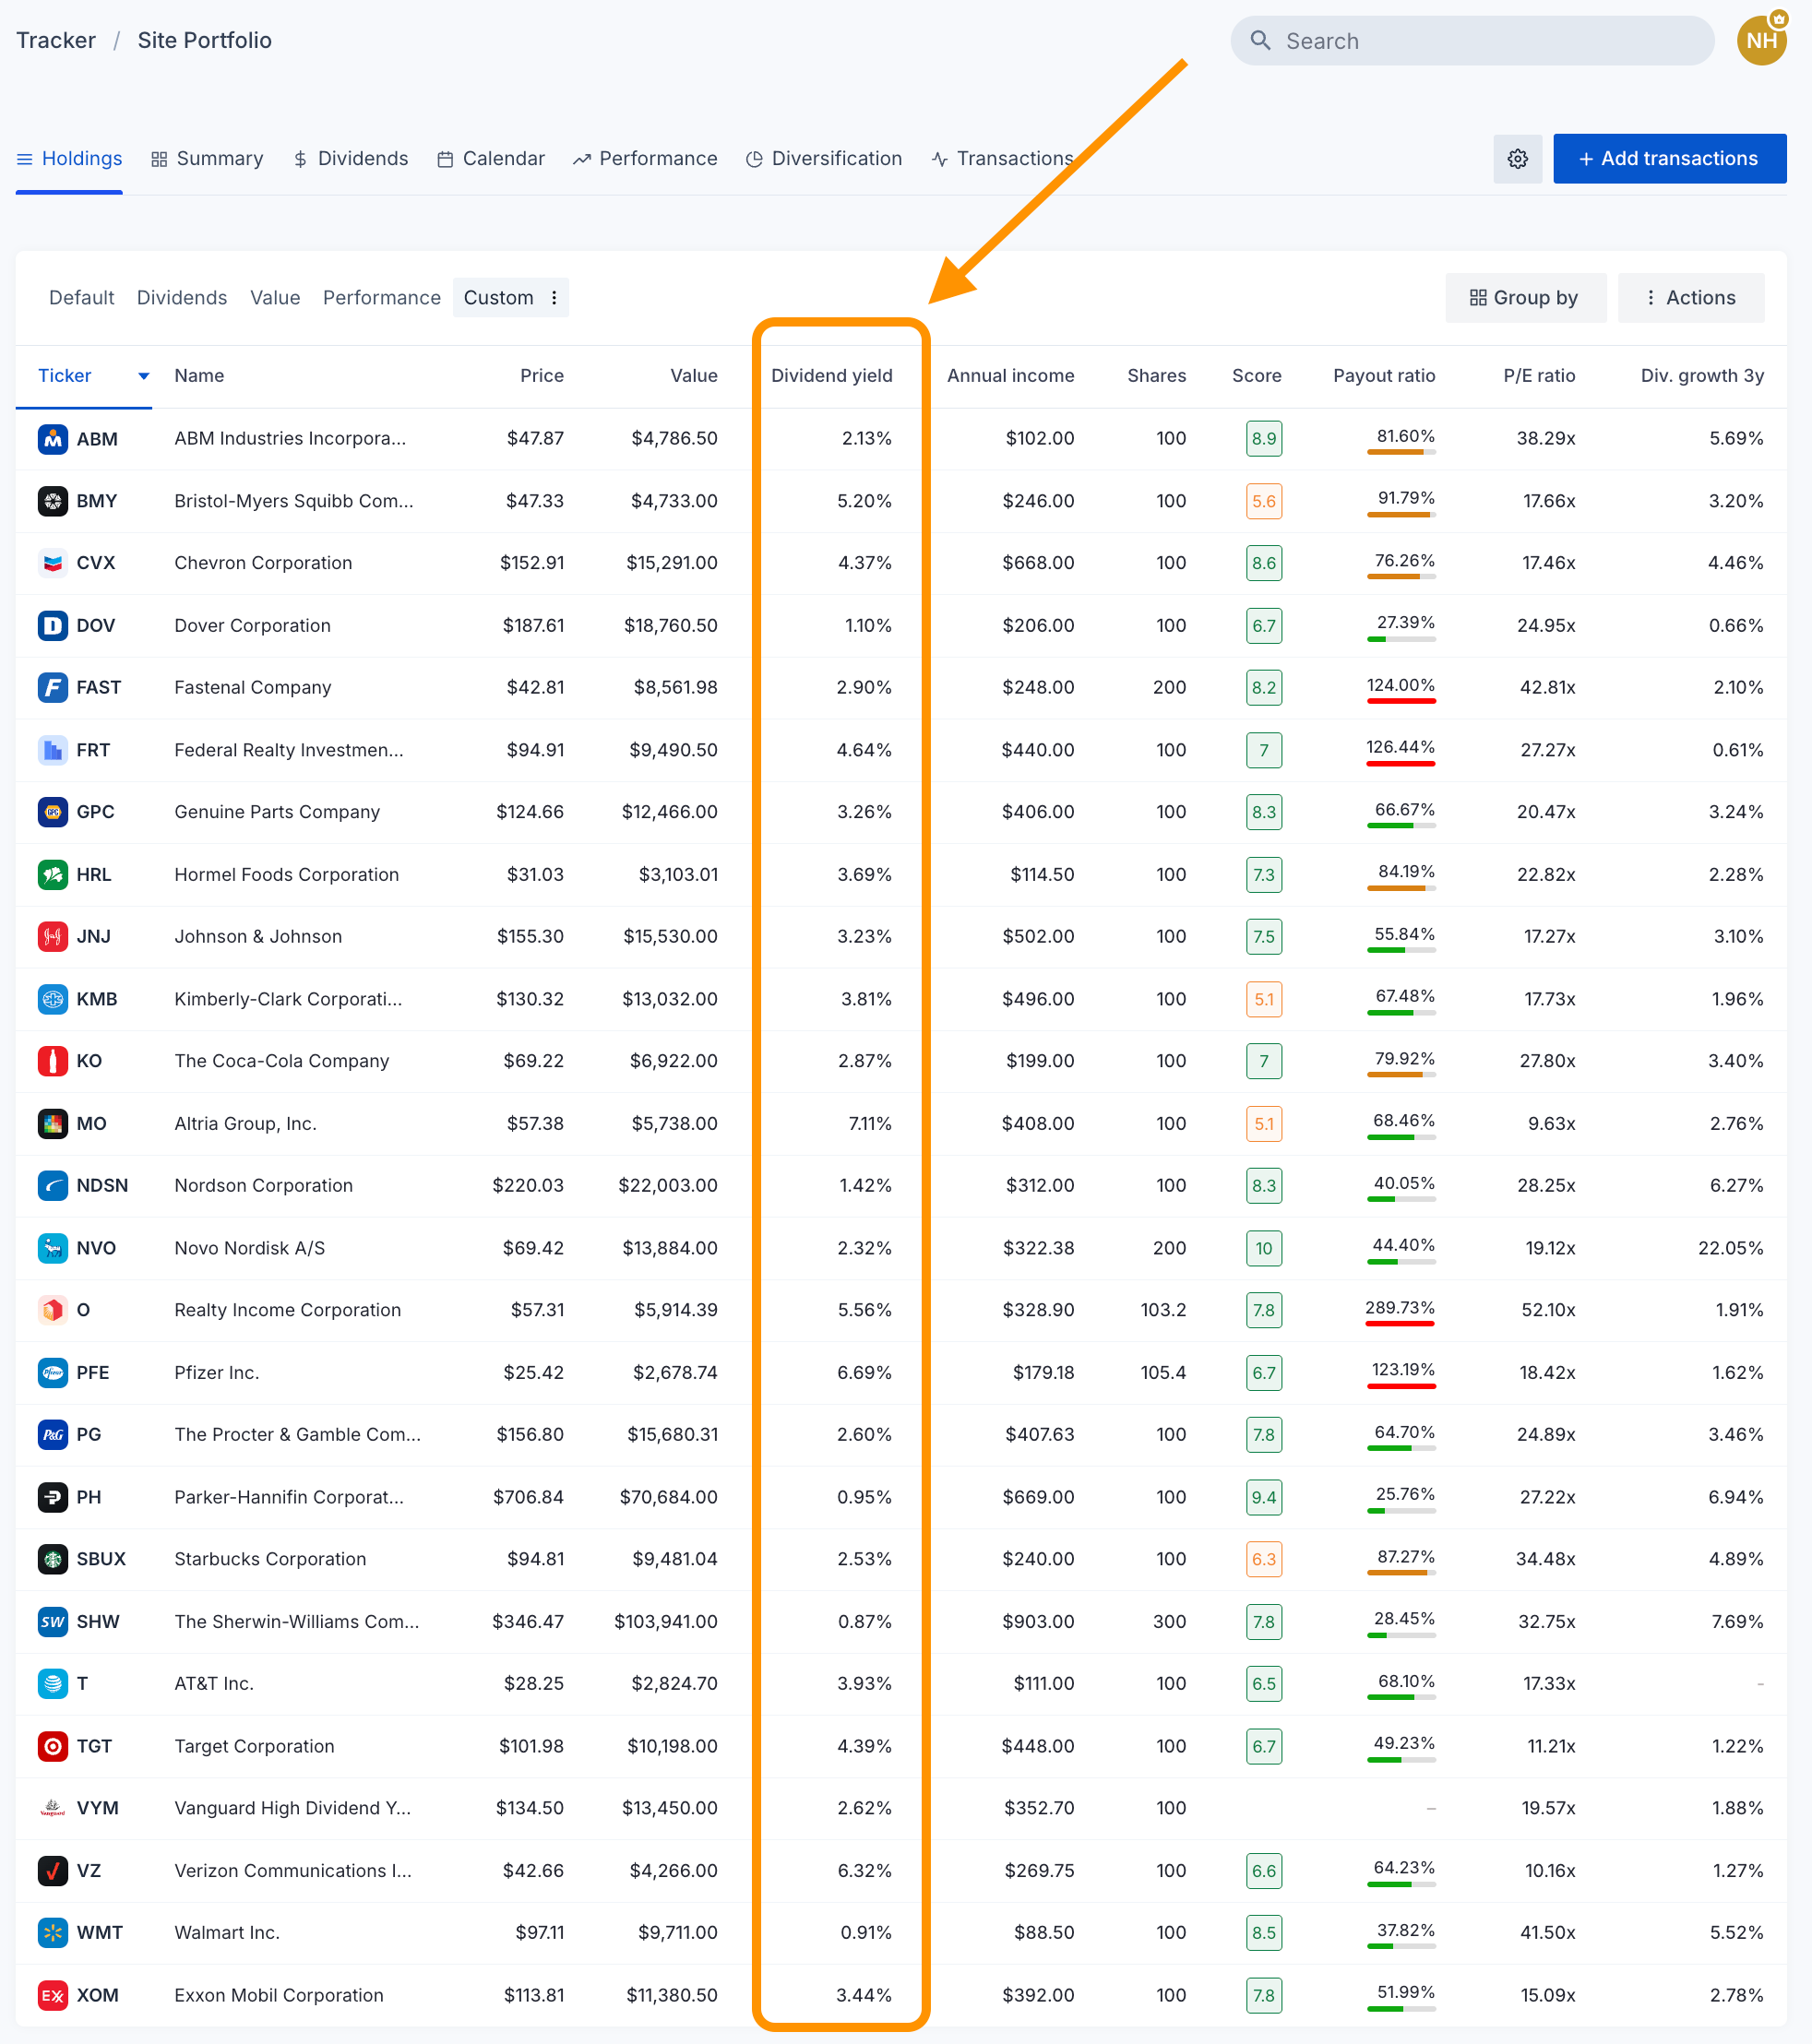
Instantly access detailed dividend insights for individual stock holdings. Source: Dividend Watch
FAQ
How does yield affect total returns?
Dividend yield contributes to your total return along with share price appreciation. A 3% yield plus a 5% stock gain equals an 8% total return. High yields can boost returns, but only if the underlying stock performs well too.
What’s the difference between a dividend and dividend yield?
A dividend is the actual cash payment a company makes to shareholders. Dividend yield is the payment expressed as a percentage of the stock price, giving you a way to compare income potential across investments.


