


Dividend Payout Ratio: What It Is, Formula, and Why It Matters
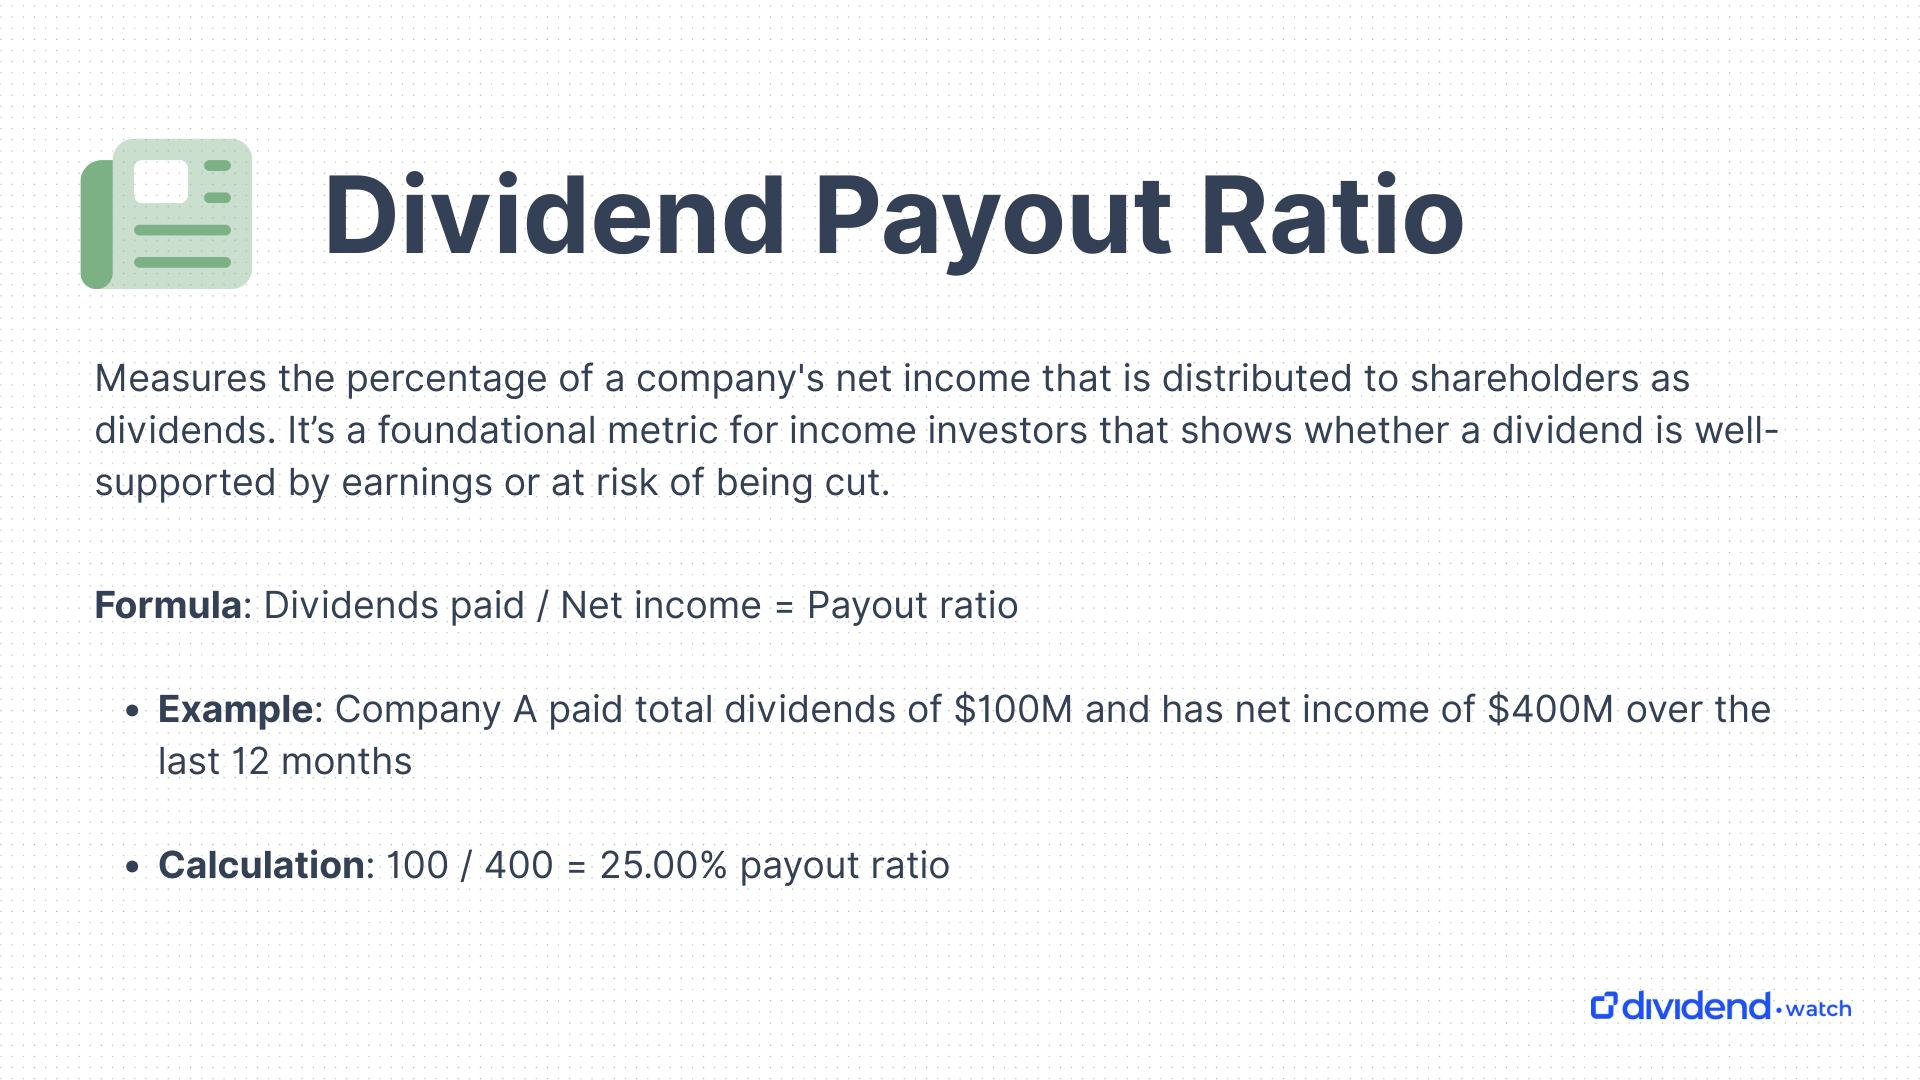
The dividend payout ratio measures the percentage of a company's net income that is distributed to shareholders as dividends. The ratio is calculated as dividends paid divided by net income. It’s a foundational metric for income investors because it shows whether a dividend is well-supported by earnings or at risk of being cut.
This essential ratio also provides investors with a snapshot of a company’s capital allocation strategy. Is the business prioritizing growth by reinvesting profits? Or is it rewarding shareholders with steady income? The payout ratio helps answer these questions, and more.
Dividend Payout Ratio Formula: Example Calculation
There are two primary ways to calculate the dividend payout ratio, at the company level or per share. Let’s walk through both using Microsoft Corporation. (MSFT) as a real-world example.
Company-Level Method
The company-level method is suitable when you don’t have easy access to individual EPS or dividend per share metrics, only total dividends paid from the cash flow statement and total net income from the income statement.
Formula: Dividend Payout Ratio = Total Dividends Paid ÷ Net Income
In fiscal 2024, Microsoft paid $21.771 billion in dividends and generated net income of $88.136 billion, resulting in a payout ratio of 24.70%.
Payout Ratio = 21.771 ÷ 88.136 = 24.70%
This figure illustrates that Microsoft is returning approximately a quarter of its earnings to shareholders and retaining the remainder to reinvest in its cloud, AI, and other businesses, to drive revenue and share price growth.
Per-Share Method
The per-share method utilizes dividends per share and EPS, both of which are commonly found on the income statement.
Formula: Dividend Payout Ratio = Dividends Per Share ÷ EPS
In fiscal year 2024, Microsoft reported EPS of $11.86, and it paid an annual dividend of $3.00 per share, resulting in a 25.29% payout ratio.
Payout Ratio = 3.00 ÷ 11.86 = 25.29%
Preferred Dividend Considerations
Some adjustments are required when a company pays preferred dividends, ensuring that you evaluate only the dividends available to common shareholders. Preferred dividends are contractually obligated payments and take priority over common dividends, so subtracting them gives a more accurate view of how much earnings are available for common shareholders, using the formula as follows:
Formula: Adjusted Payout Ratio = (Dividends - Preferred Dividends) ÷ (Net Income - Preferred Dividends)
However, consider that many companies don’t issue preferred stock, explaining why the company-level and per-share methods are most important to understand.
Why Is the Dividend Payout Ratio Important?
The payout ratio helps investors evaluate dividend sustainability and a company’s capital allocation strategy. A company paying out more than it earns (e.g., over 100%) is likely relying on debt or cash reserves, which is an unsustainable path. Meanwhile, a low payout ratio may indicate several things, including a preference to reinvest profits into growth.
More broadly, the payout ratio can reflect a company’s maturity. Younger firms tend to reinvest heavily, particularly in growth sectors such as information technology. In contrast, established giants often return more capital to shareholders, as these companies typically have sparse high-growth investments to pour cash into.
How to Use the Dividend Payout Ratio to Analyze Stocks
When used alongside other financial metrics, the dividend payout ratio becomes a powerful tool for investors to:
- Assess dividend safety: A low to moderate payout ratio (typically 30%–60%) suggests a company has room to maintain or grow its dividend even during economic downturns. Extremely high ratios (above 80%) may signal risk, especially if earnings decline. Compare the payout ratio to a company’s historical average and peers in the same sector for context.
- Identify growth vs. income opportunities: Companies with low payout ratios are often reinvesting profits to fund expansion, making them appealing to investors seeking long-term capital appreciation. In contrast, high payout ratios may indicate a company prioritizes returning cash to shareholders, which could be better suited for income-focused investors or retirees.
- Spot red flags early: If a company’s payout ratio is rising while earnings are stagnant or declining, it may be stretching to maintain its dividend. That could signal a potential cut ahead and act as a flag to compare earnings growth trends and free cash flow.
- Tailor your portfolio by strategy: Use the payout ratio to align holdings with your goals. For example, dividend growth investors may favor firms with rising earnings and stable payout ratios. At the same time, high-yield seekers might accept higher ratios if the business is mature and cash-generative.
The ratio is especially useful when researching dividend kings and dividend aristocrats, which have consistently raised their dividends for decades. Putting each stock through the lens of the payout ratio helps assess dividend growth potential and safety.
What's a Good Payout Ratio?
There’s no one-size-fits-all number across sectors, but some ballpark rules apply:
| Payout Ratio | Interpretation |
|---|---|
| Under 60% | Typically healthy and sustainable, which leaves room for dividend increases |
| 50%–70% | Reasonable for mature, stable businesses |
| Over 75% | May be fine for utilities or REITs, but warrants scrutiny |
| Over 100% | Often unsustainable unless supported by large cash reserves or a result of temporary earnings dips that inflate the ratio |
The best dividend growth stocks have payout ratios that are low enough to leave room for reinvestment and consistent dividend increases, while also withstanding unforeseen downturns. This flexibility allows companies to continue paying dividends even in lean years, while also funding innovation or expansion initiatives that can drive future earnings and potentially higher dividends, in the long run.
Industry/Sector Payout Ratios
Comparing a company’s payout ratio to its peers provides essential context. Some sectors, such as utilities and real estate, naturally support higher payout ratios due to their predictable cash flows and regulatory structures. Other sectors, like information technology or biotechnology, prioritize reinvestment and often report lower payout ratios.
Without understanding these norms, a payout ratio might look risky or conservative when it's actually right in line with sector expectations. Here’s a brief overview of some sectors that fall outside of the norms:
- Utilities and telecoms: Often have payout ratios of 70% or higher, thanks to stable cash flows
- Information technology and biotechnology: Typically lower payout ratios, often under 30%, to support innovation and growth
- Real Estate/REITs: Payout ratios are often high due to property sales and accounting charges distorting earnings. Most investors use an alternative approach to assessing dividend sustainability by reviewing funds from operations trends.
Related Ratios
Beyond the dividend payout ratio, several related metrics offer additional insight into a company's dividend policy and financial flexibility. These ratios differ in focus but work together to give a clearer picture of both the investor's income and the company's earnings management strategy.
Payout Ratio vs. Dividend Yield
The payout ratio and dividend yield are related because both help assess the attractiveness of dividends. However, while the payout ratio tells you how affordable the dividend is for the company, the yield tells you what return you're getting as an investor. Use dividend yield to compare income potential across stocks and the payout ratio to assess the sustainability of that income.
- Payout Ratio: Measures how much of a company's earnings are distributed as dividends.
- Dividend Yield: Reflects how much dividend income investors receive per dollar invested.
Payout Ratio vs. Dividend Coverage Ratio
The dividend coverage ratio shows how many times a company’s earnings can cover its dividend payments. In many scenarios, a higher coverage ratio indicates a safer dividend. Use this metric when you want to understand dividend security more directly, especially in industries where earnings are volatile.
- Coverage Ratio = Net Income ÷ Dividends
Retention Ratio
The retention ratio is the inverse of the payout ratio and measures the portion of earnings a company retains rather than paying out as dividends. It's closely tied to reinvestment strategy and future growth potential. Use this ratio when evaluating a company’s capacity to fund internal projects, repay debt, or build cash reserves.
- Retention Ratio = 1 - Dividend Payout Ratio
How to find the dividend payout ratio
When reviewing company financial statements, net income, EPS, and dividends per share are typically all included on the income statement. Since the income statement includes both earnings and dividends in per-share form, most investors use the per-share method to calculate the ratio.
You’ll need to review the income statement for total net income and the cash flow statement for dividends paid to calculate the ratio using the company-level method of dividends paid divided by net income.
Inside the Dividend Watch tracker, we automatically calculate the payout ratio for each stock held in your portfolio, as well as providing the figure for all watchlist stocks.
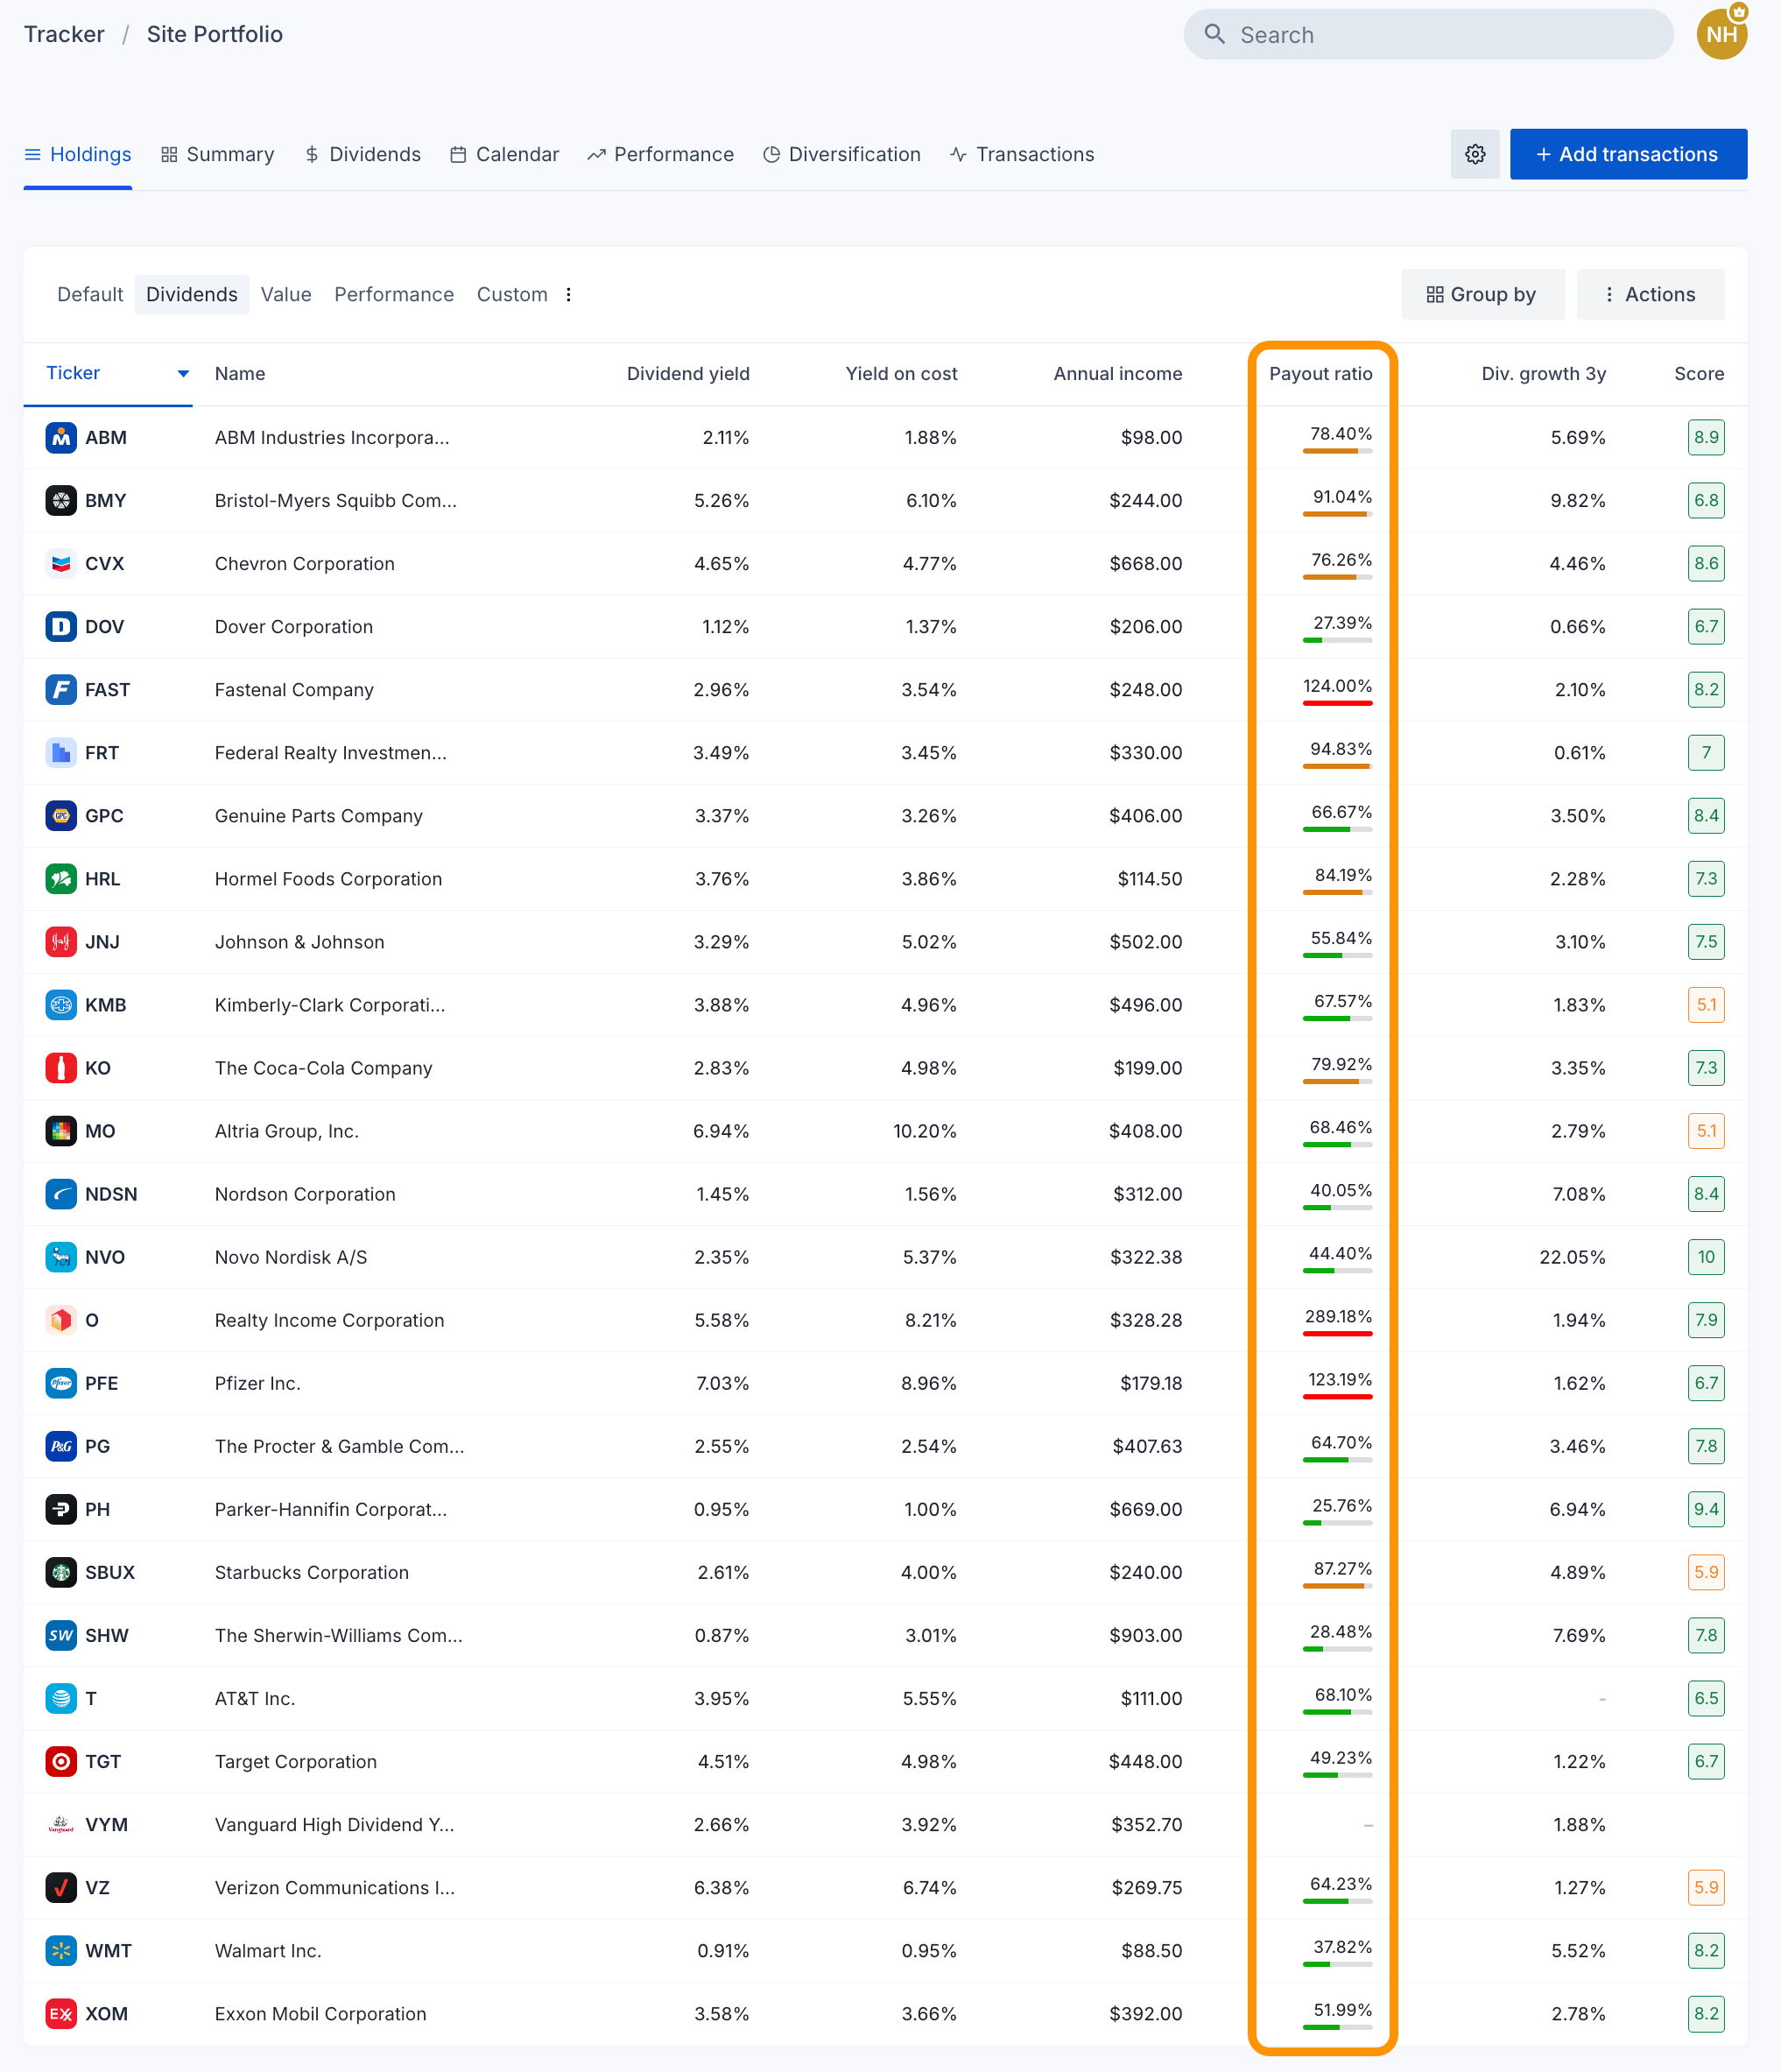
Portfolio holdings view displaying key metrics, including the payout ratio: Source: Dividend Watch
What's the S&P 500 Payout Ratio?
As of mid-2025, the total dividend payout ratio for S&P 500 companies is 29.38%, according to S&P Global. This balanced level supports both dividend income and earnings reinvestment. Investors can use this benchmark to compare individual stocks against the broader market’s approach to capital returns.


